← Case Studies
Case № 05 · Practicum by Yandex

A/B Testing the Externship USP

"How to validate a custdev hypothesis at scale and shorten the sales cycle without running 11,000 interviews."
Sales cycle: 30 days → 10 days+30–40% conversion liftHypothesis confirmed at scale
Slide 01Before

Before the test, two metrics were moving in the wrong direction, at the same time.

What we saw in the data
Completion rate↓ dropping
Purchase conversion↓ dropping
Sales cycle10 days → 30 days
Two signals, one root cause: the page was attracting the wrong people, or failing to convince the right ones.
What we did before the test
  1. Ran custdev interviews with 30% of active and potential users
  2. Identified the gap: students were buying employment, the page was selling curriculum choice
  3. Built and validated an MVP with a small group. Hypothesis confirmed.
  4. Launched A/B test to validate at scale
The test didn't generate the insight. It confirmed it on a larger audience.
Slide 02The Hypothesis

The page sold choice. Customers were buying employment.

Control — old page
"Choose your career"
4 tracks · broad selection · generic promise
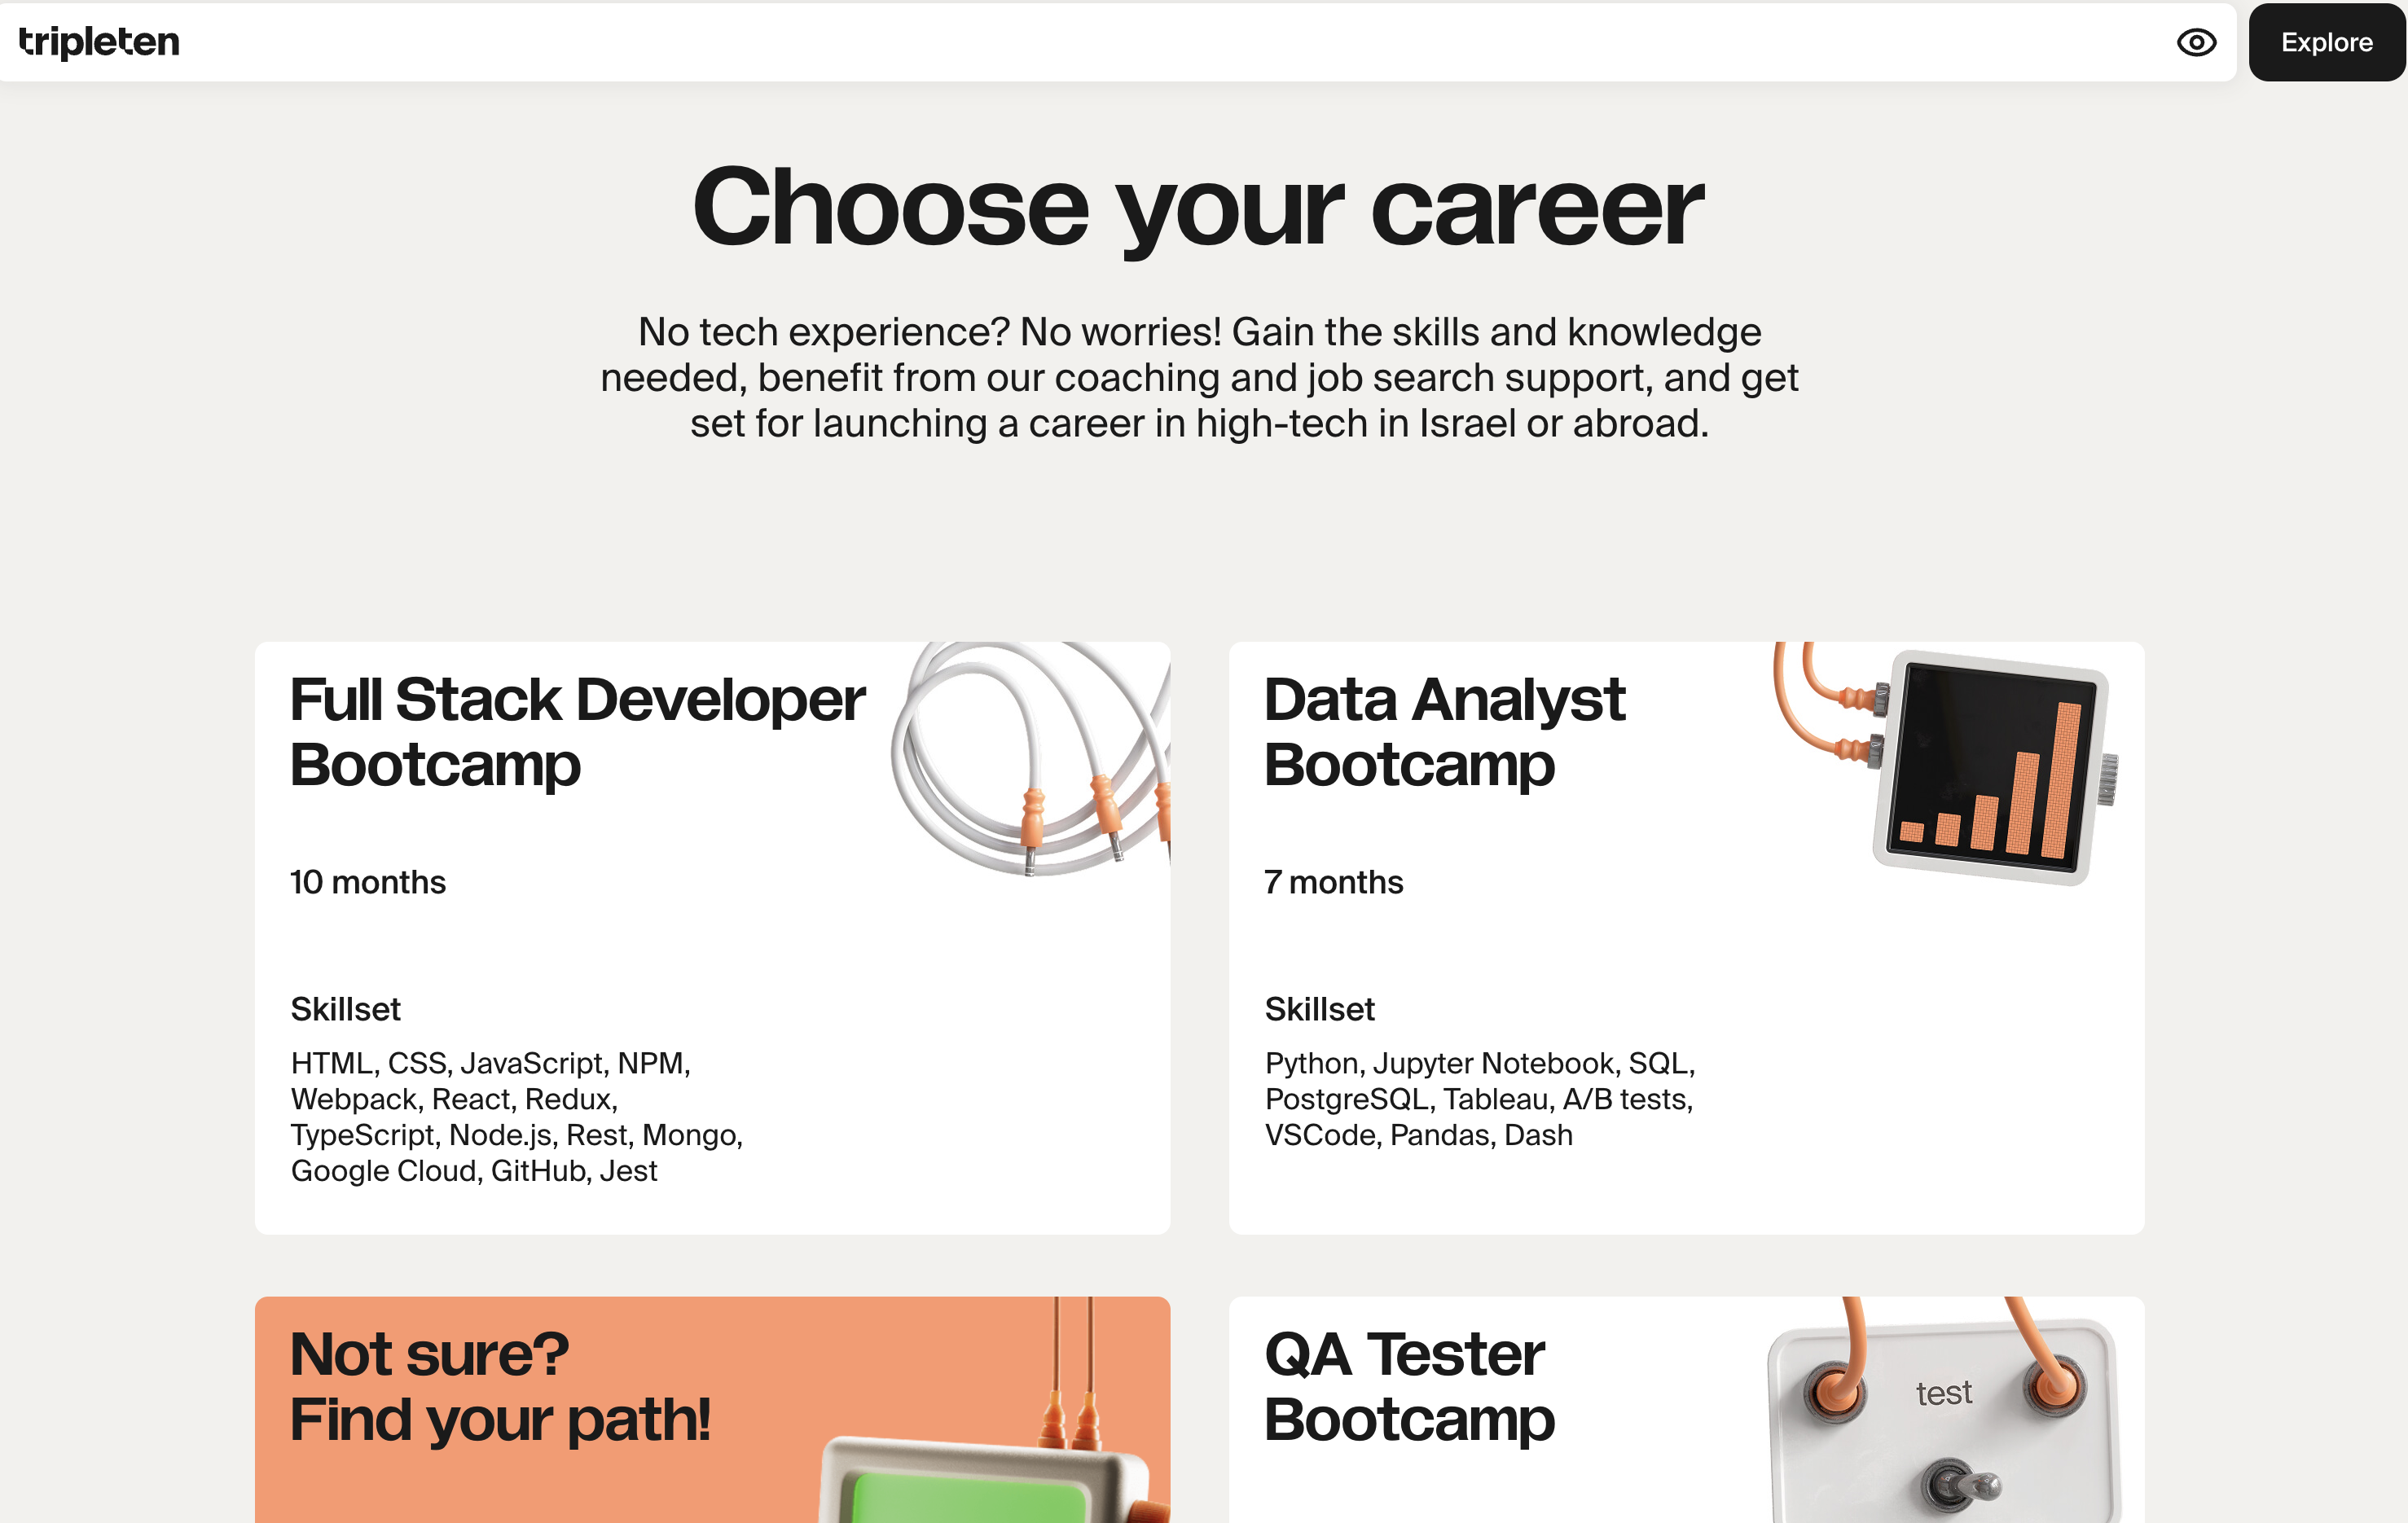
Old landing page — Choose your career
vs
Variant B — externship USP
"Apply your skills with partner companies. Add experience to your resume."
Real business problems · Portfolio projects · Live presentation to employer representatives
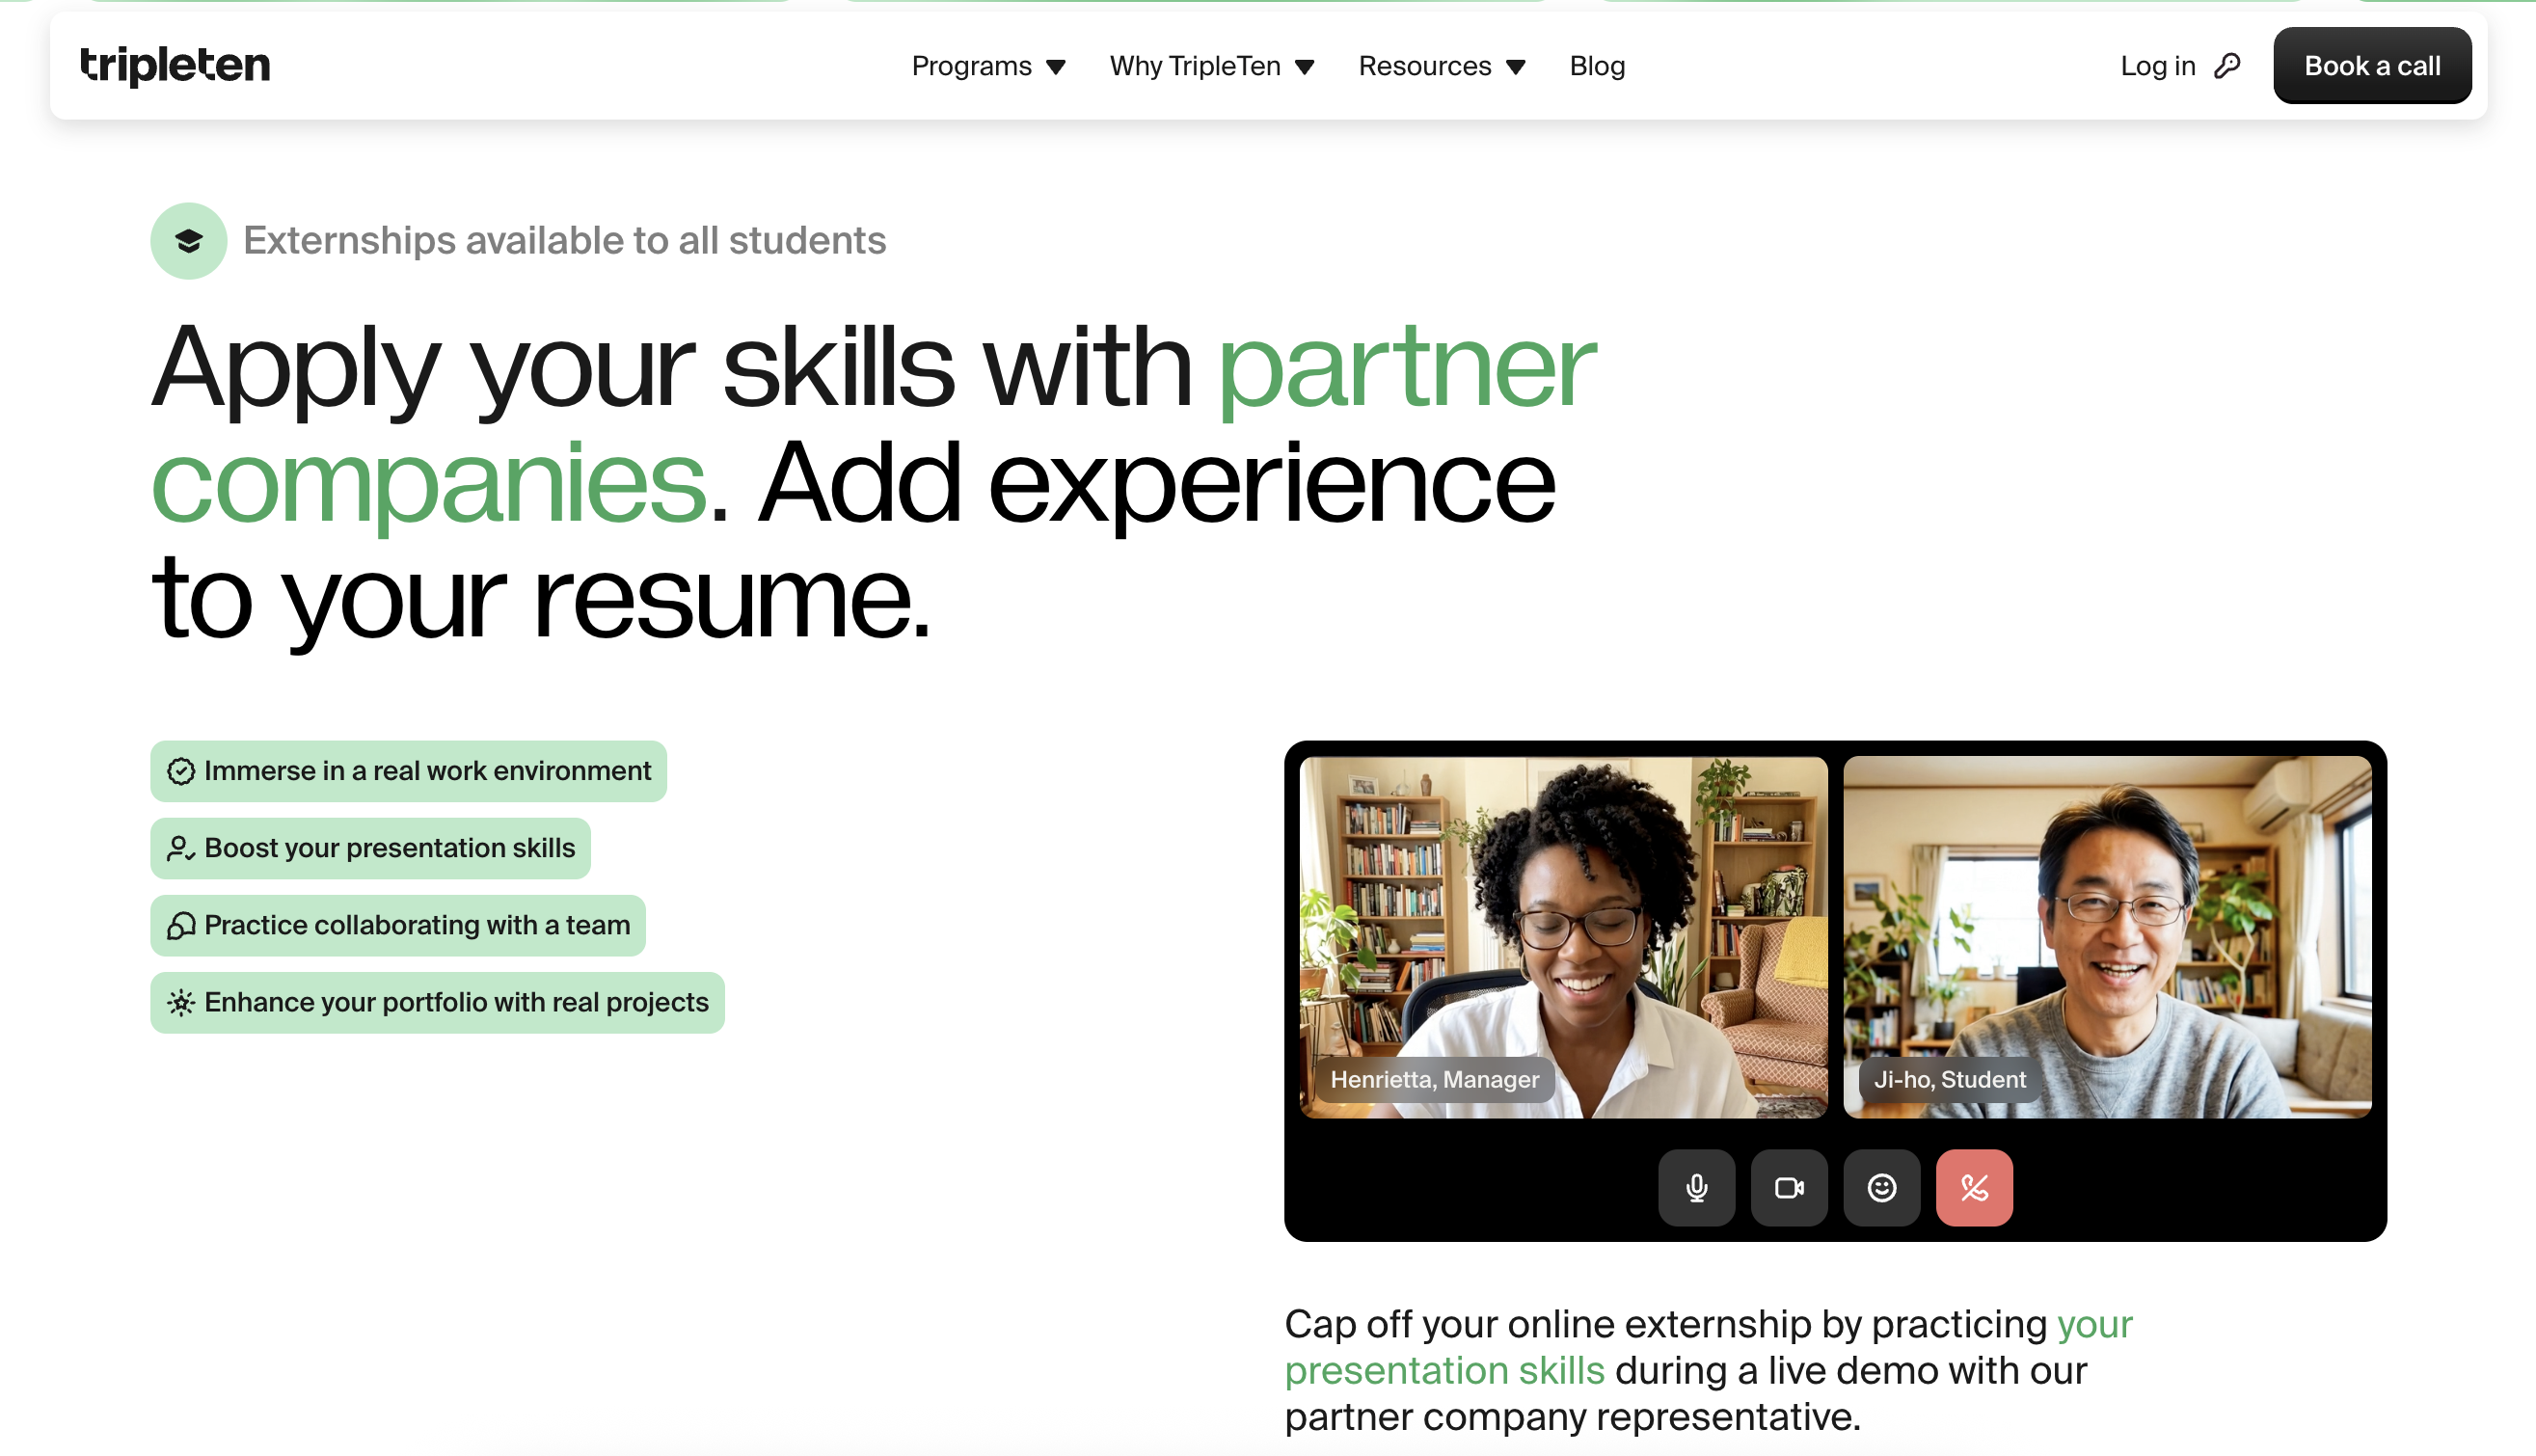
Externship USP landing page
Where the insight came from Custdev interviews with 30% of active and potential users. The test confirmed what those conversations revealed.
Slide 03The Test Design

Parameters locked before launch. Not adjusted mid-run.

Test parameters
Baseline
3.0–3.5%
Visitor → qualified lead on control page
Target MDE We didn't derive MDE from economics. The change cost us almost nothing — rewriting the first screen — so there was no ROI floor below which a result would be meaningless.The constraint was time. Minimum two weeks to capture full weekly cycles. At 800 daily visits, that's ~11,200 visitors, or ~5,600 per variant. That sample size, at a 3.0–3.5% baseline with standard 95% confidence and 80% power, can detect an effect of roughly 1 percentage point — or about +30% relative.So +30% wasn't a goal or a significance threshold. It was the sensitivity limit of the test given our available traffic and acceptable timeline. We consciously accepted not seeing smaller effects in exchange for speed: catching a +15% lift would have required roughly two more months — and the landing page would have been rewritten anyway by then.The actual result came in at +30–40%, well above the sensitivity floor, which made the question moot.
+30% rel.
Minimum meaningful lift worth detecting
Sample needed
6–11k
Total visitors across both variants
Duration
≥ 2wks
Full weekly cycles · no early stops
Traffic allocation: every visitor sees one version, same parameters apply to both
A · 50%
B · 50%
Single URL · client-side swap · user assigned via cookie · 95% confidence · 80% power · Tools: Google Optimize → VWO / Optimizely · GA4
Slide 04The Numbers

The hero metric wasn't on the page. It was in the sales team's calendar.

Hero metric
30 days → 10 days
Sales cycle length · before vs. after
Supporting metric: page conversion
3.5%
Control · old page
visitor → qualified lead
5.0%
Variant B · externship USP
↑ 30–40% relative lift
Shorter sales cycle · More qualified conversations · Faster enrollment decisions
⚠ Note: a PR push was running in parallel and was factored in as an additional variable during analysis. Results reflect the combined effect, with the page change as the primary tested factor.
Slide 05The Real Insight

9 months later, the data confirmed what the test suggested.

2 weeks
A/B test ran
Conversion lift confirmed
Immediate
Sales cycle effect
Shorter time from visit to enrollment decision
9+ months
Completion rate
Students who enrolled via externship USP graduated at higher rates
The test was designed to measure conversion. The completion rate finding came later, as a bonus. In EdTech, Completion Rate is one of the most important product metrics. The externship page didn't just convert more leads. It attracted students who were more committed to finishing.

The setup.

A/B testing is one of the most overrated and simultaneously underused tools in product marketing. Overrated, because most teams expect it to generate discoveries. Underused, because most teams test the wrong thing: button color instead of the offer, CTA wording instead of the value proposition, presentation instead of substance.

A test doesn't discover anything. It confirms and monetizes what you already learned through qualitative research. The strongest A/B results always follow deep customer interviews, when the hypothesis is sharp enough to produce a noticeable effect on real traffic.

For companies trying to improve conversion, the right question isn't "what should we test" but "what do we already know well enough to bet money on." Without an answer to that question, a test becomes an expensive way to confirm that you don't know your product or your customer well enough.

What had to be true.

Practicum by Yandex USA tripleten.com ↗
EdTech · 1.9M monthly web visits

Best Online Bootcamp 2020–2022.

Before the test was designed, two metrics were declining simultaneously: completion rate and purchase conversion. The sales cycle had stretched from 10 days to 30. Two signals pointing at the same root cause: the page was either attracting the wrong people, or failing to convince the right ones that this was worth buying.

By the time the A/B test launched, the externship program had already been validated through customer discovery and an MVP. Interviews with 30% of active and potential users had given a clear answer: people were buying employment, not education. The old landing page with its "Choose your career" headline and four tracks on the first screen wasn't selling that. It was selling optionality.

The test had one job: to check whether the new offer "Apply your skills with partner companies. Add experience to your resume." with real business problems, portfolio projects, and live presentations to employer representatives as proof, produced a measurable lift in visitor → qualified call lead conversion. And to do that in a way where the decision came from statistics, not gut feel.

A PR push around the program launch was running in parallel and was factored in as an additional variable during analysis — standard practice when you can't control all external factors in a real business environment.

You've done the interviews. You think you know what your customer needs. How do you confirm it at scale, without interviewing another 11,000 people?

How it moved.

00CustDev interviews with 30% of active and potential users: hypothesis formation
01Baseline conversion rate recorded before test launch
02MDE defined — minimum effect size meaningful to the business MDE (Minimum Detectable Effect): the smallest improvement worth detecting. The smaller the effect you want to catch, the more traffic you need.
03Required traffic volume and test duration calculated
04Single primary metric selected, tied directly to revenue
05Downstream tracking configured: lead progression to payment, not just form submission
06Test deployed: 50/50 split, variant assignment via cookies, single URL with client-side swap
07Internal traffic and bots excluded; PR push flagged as confounding factor
08Results analyzed against lead quality, not just volume

What I actually did.

The process started before any test was designed, with customer discovery interviews across 30% of active and potential users. Those conversations revealed the core insight: students weren't evaluating curriculum breadth. They were asking one question: will this get me a real job? The externship program was the most concrete answer the product had. The hypothesis was that leading with it, rather than burying it, would change conversion. Those interviews followed an MVP validation with a small group, which had already confirmed the core hypothesis. The A/B test was the next step: validating it at the scale needed to make a confident product and positioning decision.

Before the test launched, three things were locked in: the baseline conversion rate of the control page (3.0–3.5% visitor → qualified lead), the minimum effect size considered meaningful (MDE of +30% relative, targeting ~4.5%), and standard reliability thresholds: 95% confidence and 80% test power.

From those parameters, the required traffic was calculated: roughly 6,000–11,000 people across both variants. At a daily traffic of ~800 people on the page, that meant approximately two weeks. Two full weeks was a hard floor, not a guideline, to capture complete weekly cycles. Weekday and weekend behavior differ, and stopping early inflates false positives.

One thing was tested: the value proposition on the first screen. Control: the old generic "Choose your career." Variant B: "Apply your skills with partner companies. Add experience to your resume." With real business problems, portfolio projects, and live presentations to employer representatives on the first screen. 50/50 split, single URL with client-side rendering, no redirect. Redirects add latency and break attribution. Each user was assigned to a variant via cookies. The same person always sees the same version.

Tools: Google Optimize initially, then VWO and Optimizely after Google Optimize was discontinued. Measurement layer: GA4.

Primary metric: visitor → qualified call lead. Guardrail metrics: what happened to the lead downstream. Did they show up to the call, enroll, complete the program, reach payment. This turned out to be the key insight: the externship variant lifted not just submission volume but lead quality and downstream conversion to payment. A page that "lost" on raw form submits could win on students who actually paid and completed.

One honest caveat: the parallel PR push brought in a different audience and raised brand awareness simultaneously with the test. That's a confounding factor we couldn't isolate. The 5% conversion figure is a before/after with several simultaneous changes, not a clean A/B. Inside the test itself, the control ran at 3.0–3.5% and variant B at 4.5–5.0%, a relative lift of 30–40%.

The most important finding wasn't in the numbers. The team believed the selling point was breadth of choice: four tracks, a strong curriculum, flexibility. That didn't move conversion. What moved it was one specific proof of employment. Customer interviews predicted this. The test confirmed it.

Beyond conversion, the sales team reported shorter conversations: leads arrived already understanding the externship offer and asking fewer foundational questions. The time from first contact to enrollment decision shortened. Nine months later, an additional finding surfaced: students who enrolled through the externship-led page completed the program at higher rates. In EdTech, completion rate is one of the most important product metrics. This was a bonus the test wasn't designed to measure.

Measurable outcomes.

  • Sales cycle dropped from 30 days to 10: leads arrived already understanding the offer, enrollment decisions came faster
  • Page conversion lifted 30–40% relative: Variant B showed 4.5–5.0% vs. 3.0–3.5% for control
  • CustDev hypothesis confirmed at scale in 2 weeks
  • 9+ months later: higher completion rate among students enrolled via the externship USP page

The stack behind it.

Skills
A/B TestingGrowth HackingCustDevProduct PositioningPerformance Tracking & ReportingKPI DevelopmentROI Analysis
Frameworks
Hypothesis-First TestingMDE FrameworkStatistical Significance TestingDownstream Funnel AnalysisConfounding Factor Identification
Tools
Google OptimizeVWOOptimizelyGA4Notion
Metrics
Visitor → Qualified Lead Conversion RateLead Quality ScoreDownstream Conversion RateMDEStatistical Significance (95%)Test Power (80%)
Resume
Shortened the sales cycle from 30 days to 10 by validating a custdev hypothesis at scale: an A/B test built on prior MVP validation and interviews with 30% of real users. Page conversion lifted 30–40% in two weeks. Nine months later, the same change showed up in completion rates.
What I'd do differently

Track the metrics you don't expect to move. The sales cycle shortening (from 30 days to 10) wasn't a planned guardrail metric. The sales team mentioned it in passing after the test ended. If I'd set it up as a tracked metric from day one, I'd have clean data instead of a team observation. Now I always ask: what else could change downstream that we're not planning to measure? And I add it to the tracking setup before launch, not after.

Segment the conversion, not just the total. The 40 sign-ups were an aggregate. Inside that number were two distinct audiences behaving differently. I didn't break conversion down by segment during the test, which meant the result told me the page worked, but not for whom it worked better. If I ran this again, I'd tag traffic by segment from the start and treat each as a separate hypothesis. The aggregate answer is useful. The segmented answer is actionable.